wtorek, 10 września 2024

Using certificates signed by custom CA in SSL comumunication in Python applications

If you are dealing with AI these days like myself you are probably deploying a lot of python applications in containers. If your applications are referencing AI models API endpoint you are most likely also dealing with SSL communication configuration.

In this post I'll quickly explain how to validate certificates signed by custom CA in SSL communication in Python applications (using requests package) needed to access the CA certificates chain used to sign the certificate used by secured service. Here is guideline how this can be achieved in OpenShift or other Kubernetes flavour.

1. First we need to download certificate chain used by the secured service:

$ openssl s_client -showcerts -connect my-service.my-domain.local:443 < /dev/null | sed -ne '/-BEGIN CERTIFICATE-/,/-END CERTIFICATE-/p' > certificate_chain.pem

If CA certs are missing you must manually copy them to certificate_chain.pem

We can quickly check what is the content of the file:

$ cat certificate_chain.pem | openssl crl2pkcs7 -nocrl -certfile /dev/stdin | openssl pkcs7 -print_certs | grep subject | head

2. Next let's create secret containing these certificates:

$ oc create secret generic ca-certs --from-file=cacerts.crt=certificate_chain.pem

3. Mount secret to the python application Kubernetes deployment:

$ oc set volume deployment my-python-app --add --type secret --mount-path /var/secrets --secret-name ca-certs --read-only

4. Add environment variable REQUESTS_CA_BUNDLE to the python application Kubernetes deployment pointing to the path where secret containing certificates has been mounted:

$ oc set env deployment my-python-app REQUESTS_CA_BUNDLE=/var/secrets/cacerts.crt --overwrite=true

From now on the requests package will use these certificates to validate certificates presented by secured service referenced by the python application.  


środa, 15 marca 2023

Sustainable Computing in OpenShift

As per this blog sustainable computing concerns the consumption of computing resources in a way that means it has a net zero impact on the environment, a broad concept that includes energy, ecosystems, pollution and natural resources. 

Can we do sustainable computing in OpenShift?

Yes, we can! 

Meet the Kepler project. Kepler exposes a variety of metrics about the energy consumption of Kubernetes components such as Pods and Nodes. 

In this blog I'll describe my initial experience with deploying and using Kepler on top of OpenShift clusters.

I've installed Kepler using Helm chart, however they are also working actively on the Kepler Operator which most probably sooner or later will be the preferred installation method in OpenShift.

$ git clone https://github.com/sustainable-computing-io/kepler-helm-chart
$ cd git/kepler-helm-chart/

At this point it makes sense to review and modify values.yaml and adjust the configuration to your needs. I did some minor changes which you can review here.

$ helm install kepler . --values values.yaml  --create-namespace  --namespace kepler

Next you'll need to grant the kepler service account necessary SCC permissions and bind it to the kepler-exported daemon set. These commands must be executed using a cluster-admin account.

$ oc adm policy add-scc-to-user privileged -z kepler

$ oc patch ds/kepler-exporter --patch '{"spec":{"template":{"spec":{"serviceAccountName": "kepler"}}}}'

Optionally you can create a dedicated SCC using this example and add it to the kepler service account as I did above.

Now you should wait until kepler exporter pods are running on each node as per daemon set configuration.

$ oc get pods -n kepler
NAME                    READY   STATUS    RESTARTS   AGE
kepler-exporter-2k5cx   1/1     Running   0          14h
kepler-exporter-8ctd5   1/1     Running   0          17h
kepler-exporter-cqq9d   1/1     Running   0          17h

By default kepler exporter pods expose Prometheus metrics at /metrics uri. You can learn more about Kepler metrics here. In OpenShift to allow scraping these metrics by Prometheus you must first enable user workload monitoring as per the documentation. Next you can configure Service Monitor in kepler project. Just remember to put the kepler project name at the bottom. Once it is done you can query the metrics using PromQL. 

For example this query will show top power consuming pods in your cluster.

topk(10, kepler_container_joules_total)

Returned values are measured in Joules which can be converted to Watts. Since 1 Watt = 1 Joule per second you’ll need to use the rate() function which gives the power in Watts since the rate function returns the average per second. Therefore, to get the container energy consumption in Watts you can use the following query:

sum by (pod_name, container_name, container_namespace, node) (irate(kepler_container_joules_total{}[1m]))

Enjoy!


czwartek, 9 lutego 2023

Managing local accounts in OpenShift GitOps

OpenShift GitOps is based on the ArgoCD upstream project and provides Kubernetes operator based automation for ArgoCD instances lifecycle management on top of OpenShift. By default it is integrated with OpenShift Identity Management and RBAC which provides OpenShift users and roles integration with ArgoCD. This is great for managing user access but you might also have a need to grant access to ArgoCD for some external applications.

The solution might be to create local ArgoCD accounts with limited permissions tailored to your needs which might act as an "service account" to be used by external applications to automate integration with ArgoCD.

Local ArgoCD accounts can be configured during creation of ArgoCD CRD. You also edit existing ArgoCD CRD.

spec:
  rbac:
    policy: |
      g, system:cluster-admins, role:admin
      g, cluster-admins, role:admin
      p, tekton, applications, get, */*, allow
     p, tekton, applications, sync, */*, allow

  extraConfig:
    accounts.tekton: 'apiKey'

In the above example I have created local account called tekton with applications get and sync permissions granted for all (*/*) applications. Please have a look at ArgoCD RBAC docs for more details. 

In order to be able to generate a token for this account I also must have enabled apiKey capability. For more details about local accounts please have a look at ArgoCD Local accounts docs. Please note this account has no login capability hence it won't be able to login to ArgoCD UI or via argocd cli.

Once this is done you can always check the current ArgoCD RBAC configuration in argo-rbac-cm config map in the project/namespace where your ArgoCD instance is deployed.

Next you can login to ArgoCD UI or use argocd cli to generate access tokens for the account.


Remember to copy the new token as it won't be available anymore after you close it, and in case you lose it you'll need to generate the new one.

One of use cases for using access tokens is integration with Tekton Pipelines. Have a look at the following TektonHub task where access token based authentication can be used.


środa, 7 grudnia 2022

Checking Security Context Constraints permissions

Similar to the way that RBAC resources control user access, administrators can use security context constraints (SCCs) to control permissions for pods. These permissions include actions that a pod can perform and what resources it can access. You can use SCCs to define a set of conditions that a pod must run with to be accepted into the system.

Security context constraints allow an administrator to control:

  • Whether a pod can run privileged containers with the allowPrivilegedContainer flag.

  • Whether a pod is constrained with the allowPrivilegeEscalation flag.

  • The capabilities that a container can request

  • The use of host directories as volumes

  • The SELinux context of the container

  • The container user ID

  • The use of host namespaces and networking

  • The allocation of an FSGroup that owns the pod volumes

  • The configuration of allowable supplemental groups

  • Whether a container requires write access to its root file system

  • The usage of volume types

  • The configuration of allowable seccomp profiles

By default the cluster contains several default security context constraints (SCCs)  with different sets of permissions and privileges as per the documentation

You can specify SCCs as resources that are handled by RBAC. This allows you to scope access to your SCCs to a certain project or to the entire cluster. Assigning users, groups, or service accounts directly to an SCC retains cluster-wide scope.

For example when you assign anyuid scc to service account my-sa

$ oc adm policy add-scc-to-user anyuid -z my-sa 

corresponding role will be created and bound to the service account with cluster scope.

apiVersion: rbac.authorization.k8s.io/v1
kind: ClusterRole
metadata:
  name: system:openshift:scc:anyuid
rules:
- apiGroups:
  - security.openshift.io
  resourceNames:
  - anyuid
  resources:
  - securitycontextconstraints
  verbs:
  - use

As an cluster admin using oc cli you can check who has permissions to use specific scc.

$ oc adm policy who-can use scc anyuid

resourceaccessreviewresponse.authorization.openshift.io/<unknown>

Namespace: default
Verb:      use
Resource:  securitycontextconstraints.security.openshift.io

Users:  system:admin
        system:serviceaccount:apps-mlapps:my-sa
        system:serviceaccount:apps-sealed-secrets:secrets-controller
        ...

Groups: system:cluster-admins
        system:masters


If you are using Advanced Cluster Security for Kubernetes you can also check who has these permissions using ACS Central web UI:

On the left hand side Menu click on Configuration Management and next on the right top side click on RBAC Visibility & Configuration dropdown list and select Roles. Finally type "Role: system:openshift:scc" in the filter.

Click on any available link in User & Groups or Service Account columns to reveal list of users, groups or service accounts bound to selected SCC.


piątek, 29 lipca 2022

Configure timezone in your OpenShift cluster

You can configure timezone on your OpenShift RHEL CoreOS nodes using following machine config:

apiVersion: machineconfiguration.openshift.io/v1
kind: MachineConfig
metadata:
  labels:
    machineconfiguration.openshift.io/role: worker
  name: worker-custom-timezone-configuration
spec:
  config:
    ignition:
      config: {}
      security:
        tls: {}
      timeouts: {}
      version: 2.2.0
    networkd: {}
    passwd: {}
    storage: {}
    systemd:
      units:
      - contents: |
          [Unit]
          Description=set timezone
          After=network-online.target

          [Service]
          Type=oneshot
          ExecStart=timedatectl set-timezone Europe/London

          [Install]
          WantedBy=multi-user.target
        enabled: true
        name: custom-timezone.service
  osImageURL: "" 

Containers don't typically inherit the host time zone configuration, as container images often set their own time zone (usually UTC). It is possible to change the timezone in pods (but the OCP platform pods) using one of the following methods:

1. Set an environment variable. This sets TZ in any containers to the timezone specified.

$ oc get deployments
$ oc set env deployments/dc_name TZ=Europe/London 

2. Mount /etc/localtime to use the timezone stored in a configmap

$ oc create configmap tz-london --from-file=localtime=/usr/share/zoneinfo/Europe/London
$ oc set volumes deployments/dc_name --add \
    --type=configmap --name=tz --configmap-name=tz-london \
    --mount-path=/etc/localtime --sub-path=localtime 

If you prefer first method are you are using Red Hat Base Universal Minimal images you'll need to reinstall tzdata package to populate /usr/share/zoneinfo

FROM registry.redhat.io/ubi8-minimal
RUN microdnf reinstall tzdata -y 

czwartek, 5 maja 2022

Multi tenant metrics collection from OpenShift built in Prometheus

In one of my previous posts I've described 3 ways to collect metrics stored in OpenShift built-in Prometheus metrics database. Now I'd like to show you how you can limit access to metrics per tenant projects (namespaces). 

Built-in Thanos Queries contains dedicated tenancy port which requires namespace parameter to access metrics of objects belonging to the project. If you want to expose this port outside of the cluster you'll need to create custom route (ingress):

kind: Route

apiVersion: route.openshift.io/v1

metadata:

  name: multitenant-thanos-querier

  namespace: openshift-monitoring

spec:

  host: ROUTE_HOSTNAME

  path: /api

  to:

    kind: Service

    name: thanos-querier

    weight: 100

  port:

    targetPort: tenancy

  tls:

    termination: reencrypt

  wildcardPolicy: None


Next you can execute follwing commands to query metrics from selected namespace: 


PROJECT=sample-app-prod

SA=querier

oc project $PROJECT

oc create sa $SA

TOKEN=$(oc sa get-token $SA)

URL=$(oc get route -n openshift-monitoring | grep multitenant | awk '{print $2}')


You don't need to assign cluster-monitoring-view role to the service account but only view role in the project where you want to query the metrics:  


oc adm policy add-cluster-role-to-user view -z $SA


In the thanos querier query you must enter namespace parameter to specify which namespace metrics you want to get:  


curl -v -k -H "Authorization: Bearer $TOKEN" "https://$URL/api/v1/query?namespace=$PROJECT&query=kube_pod_status_ready"


In the results you will only see values of metrics which are related to your selected project:  

{"status":"success","data":{"resultType":"vector","result":[{"metric":{"__name__":"kube_pod_status_ready","condition":"false","container":"kube-rbac-proxy-main","endpoint":"https-main","job":"kube-state-metrics","namespace":"sample-app-prod","pod":"hello-quarkus-5859859f9f-vbhjh","prometheus":"openshift-monitoring/k8s","service":"kube-state-metrics"},"value":[1651068513.646,"0"]}]}} 

That's it. Now you only have access to metrics from the projects where you have the view role.

czwartek, 20 stycznia 2022

Harden your OpenShift clusters with CIS Openshift benchmark

In this blog post I'll describe how you can harden your OpenShift clusters  using the Compliance Operator. It is an OpenShift Operator that allows an administrator to run different compliance scans and provide remediations for the issues found. Compliance Operator leverages OpenSCAP under the hood to perform the scans. Among the others it provides CIS OpenShift benchmark compliance profiles, which provides comprehensive set of security controls for OpenShift clusters similar to CIS Kubernetes.

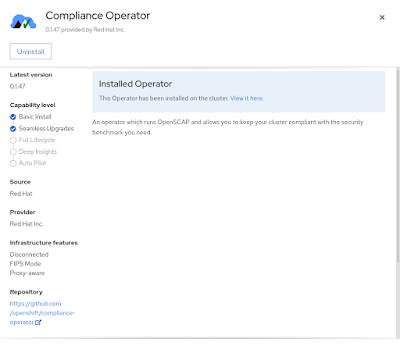
You can install it quickly from the OpenShift Web Console Operator Hub page. It will be installed by default in the openshift-compliance project.

After the installation you can check what compliance profiles are available:

$ NAMESPACE=openshift-compliance

$ oc get -n $NAMESPACE profiles.compliance
NAME                 AGE
ocp4-cis             3d2h
ocp4-cis-node        3d2h
ocp4-e8              3d2h
ocp4-moderate        3d2h
ocp4-moderate-node   3d2h
ocp4-nerc-cip        3d2h
ocp4-nerc-cip-node   3d2h
ocp4-pci-dss         3d2h
ocp4-pci-dss-node    3d2h
rhcos4-e8            3d2h
rhcos4-moderate      3d2h
rhcos4-nerc-cip      3d2h

For CIS Openshift benchmark compliance scan we'll use ocp4-cis for master nodes scanning and ocp4-cis-node for worker nodes scanning.  You can review each of them and check what compliance rules are included using following commands:

$ oc get -n $NAMESPACE -o yaml profiles.compliance ocp4-cis

$ oc get -n $NAMESPACE -o yaml profiles.compliance ocp4-cis-node

You can run both scans using following commands:

$ echo "---
apiVersion: compliance.openshift.io/v1alpha1
kind: ScanSettingBinding
metadata:
  name: ocp4-cis-node
profiles:
  - name: ocp4-cis-node
    kind: Profile
    apiGroup: compliance.openshift.io/v1alpha1
settingsRef:
  name: default
  kind: ScanSetting
  apiGroup: compliance.openshift.io/v1alpha1
" | oc create -f - -n $NAMESPACE

$ echo "---
apiVersion: compliance.openshift.io/v1alpha1
kind: ScanSettingBinding
metadata:
  name: ocp4-cis
profiles:
  - name: ocp4-cis
    kind: Profile
    apiGroup: compliance.openshift.io/v1alpha1
settingsRef:
  name: default
  kind: ScanSetting
  apiGroup: compliance.openshift.io/v1alpha1
" | oc create -f - -n $NAMESPACE

Wait until they finish executing and show PHASE value DONE as below:

$ oc get -n $NAMESPACE compliancesuites
NAME              PHASE   RESULT
ocp4-cis          DONE    NON-COMPLIANT
ocp4-cis-node     DONE    NON-COMPLIANT

If you'll see RESULT value COMPLANT you are done, but most probably you won't.

Extracting raw scan results is a bit complicated. The scans provide two kinds of raw results: the full report in the ARF format and just the list of scan results in the XCCDF format. The ARF reports are, due to their large size, copied into persistent volumes. The XCCDF results are much smaller and can be stored in a configmap, from which you can extract the results. For easier filtering, the configmaps are labeled with the scan name. You can find more details about scan results extracting here

Here is just simple example of how you can extract scan results to local file system and find failed compliance rules:

$ oc get -n $NAMESPACE cm -l=compliance.openshift.io/scan-name=ocp4-cis

$ oc extract -n $NAMESPACE cm/ocp4-cis-api-checks-pod --keys=results --confirm

$ cat results | grep fail -B1
          <rule-result idref="xccdf_org.ssgproject.content_rule_audit_log_forwarding_enabled" role="full" time="2022-01-20T07:30:17+00:00" severity="medium" weight="1.000000">
            <result>fail</result>
--
          <rule-result idref="xccdf_org.ssgproject.content_rule_configure_network_policies_namespaces" role="full" time="2022-01-20T07:30:17+00:00" severity="high" weight="1.000000">
            <result>fail</result>

Great thing about the Compliance Operator is that for majority of failed compliance rules there will be also remediation created automatically:

$ oc get -n $NAMESPACE complianceremediations

NAME
ocp4-cis-api-server-encryption-provider-config
... 

$ oc get -n $NAMESPACE complianceremediation/ocp4-cis-api-server-encryption-provider-config -o yaml

Finally these remediations can be applied manually to the cluster configuration:

$ oc patch -n $NAMESPACE complianceremediations/ocp4-cis-api-server-encryption-provider-config --patch '{"spec":{"apply":true}}' --type=merge

Applying all remediations might not be enough to achieve COMPLIANT results from the scan. There are a couple of compliance rules that will require manual intervention i.e. creation of network policies in every namespace or Kubernetes API audit log forwarding off the cluster configuration. For guidelines on how to implement these remediations please refer to Hardening Guide for OpenShift Container Platform or CIS RedHat OpenShift Container Platform v4 Benchmark.


piątek, 17 grudnia 2021

3 ways to collect metrics from OpenShift built in Prometheus

In this blog post I'll describe 3 methods of collecting metrics data from OpenShift 4 built in Prometheus. This might be especially useful if you are running a central monitoring solution outside of OpenShift and you would like to integrate it with metrics collected by OpenShift built in Prometheus.

1. Thanos Querier

The Thanos Querier aggregates and optionally deduplicates core OpenShift Container Platform metrics and metrics for user-defined projects under a single, multi-tenant interface. Thanos Querier expose route which can be queried by authorized clients using promql semantics. In order to authorize requests you must provide a bearer token belonging to a user or service account which has at minimum cluster-monitoring-view OpenShift role granted. 

Here is an example how to create service account with cluster-monitoring-view role and query Thanos Querier endpoint:

oc project openshift-monitoring
SA=querier
oc create sa $SA
oc adm policy add-cluster-role-to-user cluster-monitoring-view -z $SA

TOKEN=$(oc sa get-token $SA -n openshift-monitoring)
URL=$(oc get route thanos-querier --template='{{.spec.host}}' -n openshift-monitoring)
QUERY=node_cpu_seconds_total

curl -k -H "Authorization: Bearer $TOKEN" https://$URL/api/v1/query?query=$QUERY

2. Prometheus Federation

Federation allows a Prometheus server to scrape selected time series from another Prometheus server. Each Prometheus instance exposes /federate endpoint which might be queried using the exposed OpenShift route. For request authorization the same rules apply as for Thanos Querier authorization:

URL=$(oc get route prometheus-k8s --template='{{.spec.host}}' -n openshift-monitoring)

QUERY='match[]={__name__=~"node_cpu_seconds_total|node_memory_MemAvailable_bytes"}'


curl -G --data-urlencode "$QUERY" -k -H "Authorization: Bearer $TOKEN" https://$URL/federate

3. Remote write

Both methods described above require external systems to periodically pull metrics from Prometheus. On the contrary, remote write allows you to push metrics from Prometheus to remote systems.

Remote write configuration must be done in the cluster-monitoring-config config map located in openshift-monitoring namespace:

apiVersion: v1

kind: ConfigMap

metadata:

  name: cluster-monitoring-config

  namespace: openshift-monitoring

data:

  config.yaml: |

    prometheusK8s:

      remoteWrite:

      - url: "https://remote-write.endpoint"

        writeRelabelConfigs:

        - sourceLabels: [__name__]

          regex: 'node_cpu_seconds_total|node_memory_MemAvailable_bytes'

          action: keep

Above you can see a fairly simple configuration which will push only 2 filtered metrics data to the remote endpoint in default intervals of 1 minute. There is much more configuration possible as per Prometheus documentation. All these configurations can be created in the cluster-monitoring-config config map, but please note you must follow naming conventions according to Prometheus Operator specification which is slightly different from Prometheus documentation.

środa, 17 listopada 2021

Secure your workloads in OpenShift Container Platform

In this blog post I will discuss the OpenShift security use cases that Red Hat Advanced Cluster Security for Kubernetes addresses and identify the benefits of taking a Kubernetes-native approach to securing your containerized applications in OpenShift.

Containers and microservices initiated a shift in application infrastructure, and Kubernetes has emerged as one of the most quickly adopted technologies ever, helping companies automate the management of these application building blocks. This massive change in infrastructure has driven a parallel change in security, as new tooling and processes are needed to apply controls to the cloud-native stack.

In today’s Kubernetes world, it is no longer adequate to secure just your images and containers. You need a security platform that protects your entire Kubernetes environment across the entire applications lifecycle covering Build, Deploy and Runtime applications lifecycle phases.


Source: https://www.tigera.io/lp/kubernetes-security-and-observability-ebook/

Benefits of Kubernetes-Native Security

Red Hat Advanced Cluster Security for Kubernetes was purpose-built for the modern cloud-native stack. We have built multiple deep integrations with Kubernetes into our platform, making your security as portable, scalable, and resilient as your hybrid cloud infrastructure. This Kubernetes-native approach also delivers the most comprehensive set of container and Kubernetes security capabilities across the full application life cycle.


These advantages, derived from our tight integrations with Kubernetes, enable a better security outcome. While many container security providers highlight a common set of use cases, how you deliver those use cases impacts the result. The following discussion of the top OpenShift security use cases illustrates the advantages of applying a Kubernetes-native architecture.

Visibility

You cannot secure what you cannot see. As a first step, you must gain visibility into your OpenShift environment. You should know what images you are using, understand their provenance, whether they contain any vulnerabilities and their severity level, and that is just the start. You must also know which pods, namespaces, and deployments are running vulnerable containers and their attack surface and potential blast radius in the event of a breach.


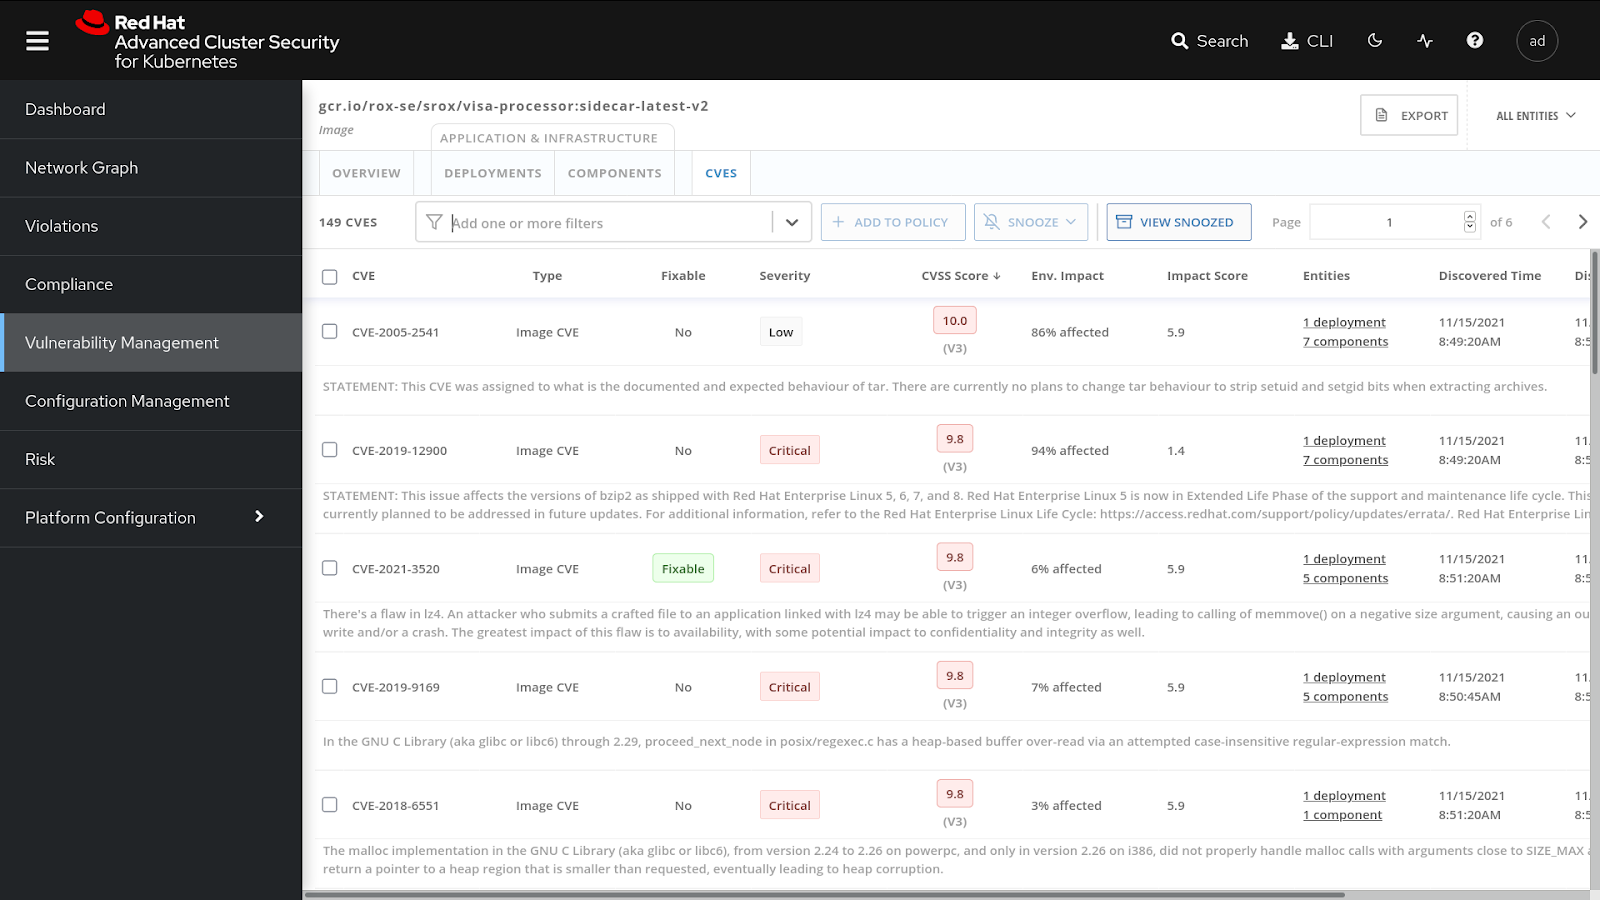
Red Hat Advanced Cluster Security for Kubernetes provides visibility into your entire OpenShift environment and accompanying security issues, including the images, containers, and vulnerabilities with CVE and severity scores
This visibility is enhanced with contextual data from Kubernetes, such as allowed network paths, runtime process execution, secrets exposure, and other attributes of the environment.

Vulnerability Management

One of the most critical steps in securing containers in OpenShift is to prevent images with known, fixable vulnerabilities from being used as well as to identify and stop running containers that have vulnerabilities. You must also run on-demand vulnerability searches across images, running deployments, and clusters to enforce policies at build, deploy, and runtime.

A vulnerability management solution must also integrate with your CI/CD pipeline to fail a build if it contains a vulnerability while providing the developer details on why the build failed and how to remediate it.

Red Hat Advanced Cluster Security for Kubernetes delivers full life cycle image and container scanning. We combine details about vulnerabilities with Kubernetes data and the life cycle stage that the vulnerability impacts in order to quantify the security risk that a given vulnerability poses to your environment. This also allows us to pinpoint which pods, namespaces, deployments, and clusters are impacted by a given vulnerability.

Risk Profiling

A common pain point is being overwhelmed with security alerts and incidents that need investigation without any guidance on prioritization. This approach inevitably leads to instances where high-risk security issues trail low/medium-risk issues in remediation simply because teams cannot identify which problems present the highest risk. Or in the worst case scenario, without prioritization, nothing is remediated.

Red Hat Advanced Cluster Security for Kubernetes provides a numerical risk-based ranking for each deployment based on information across the entire application life cycle. We correlate image vulnerabilities and their severity with rich contextual data that empowers users to understand which deployments are in need of immediate remediation so that the highest risk deployments are addressed first.

Network Segmentation

Containers pose a unique networking challenge because containers communicate with each other across nodes and clusters (east-west traffic) and outside endpoints (north-south traffic). As a result, a single container breach has the potential to impact every other container. Therefore, it is imperative to limit a container’s communication in adherence with least privilege principles without inhibiting your container’s functional goals.

Our approach to network segmentation leverages the built-in feature in Kubernetes known as Network Policies, which gives robust and portable enforcement that scales as Kubernetes scales. This also ensures that security, operations, and development teams use a single source of truth and consistent information to effectively restrict network access.  

Runtime Threat Detection and Response

Once container images are built and deployed into production, they are exposed to new security challenges and external adversaries. The primary goal of security in the runtime phase is to detect and respond to malicious activity in an automated and scalable way while minimizing false positives and alert fatigue.

Red Hat Advanced Cluster Security for Kubernetes combines automated process discovery and behavioral baselining with automatically creating an allowed list of processes to determine actual threats from benign anomalies.

It also provides pre-configured threat profiles that detect common threats including cryptocurrency mining, privilege escalation, and various other exploits. Because it uses Kubernetes-native controls to mitigate threats with actions such as killing pods and restarting them fresh or scaling deployments to zero, it ensures incident response does not result in application downtime or pose other operational risk.

Configuration Management

The configuration options for container and Kubernetes environments run deep and can be challenging for security teams to get right. In sprawling container and Kubernetes environments, it is not advisable to manually check each security configuration for each asset to assess its risk.

While the CIS Benchmarks for Docker and Kubernetes provide helpful guidance and a useful framework for hardening your environment, they contain hundreds of checks for different configuration settings. Ensuring continuous adherence to the CIS benchmarks and other configuration best practices can be challenging without automation.

Red Hat Advanced Cluster Security for Kubernetes gives a deployment-centric view of how their images, containers, and deployments are configured prior to running to identify missed best practices and recommendations. It evaluates how you are using role-based access control (RBAC) to understand user and service account privileges to identify risky configurations. It also tracks the use of secrets to identify unnecessary exposure so you can proactively limit its access.

When it detects misconfigurations, it allows you to build custom policies or use one of its out-of-the-box rules to enforce better configuration – at build time with CI/CD pipeline integration or at deploy time using dynamic admission control.

Compliance

DevOps moves fast and relies on automation for continuous improvement; therefore, organizations need a compliance solution built to complement, not inhibit, DevOps activities. You not only need to adhere to industry compliance requirements but also show proof of continuous adherence.

Lastly, you also need to adhere to internal policies for security configurations and other best practices to prevent non-compliant builds or deployments from being pushed to production.

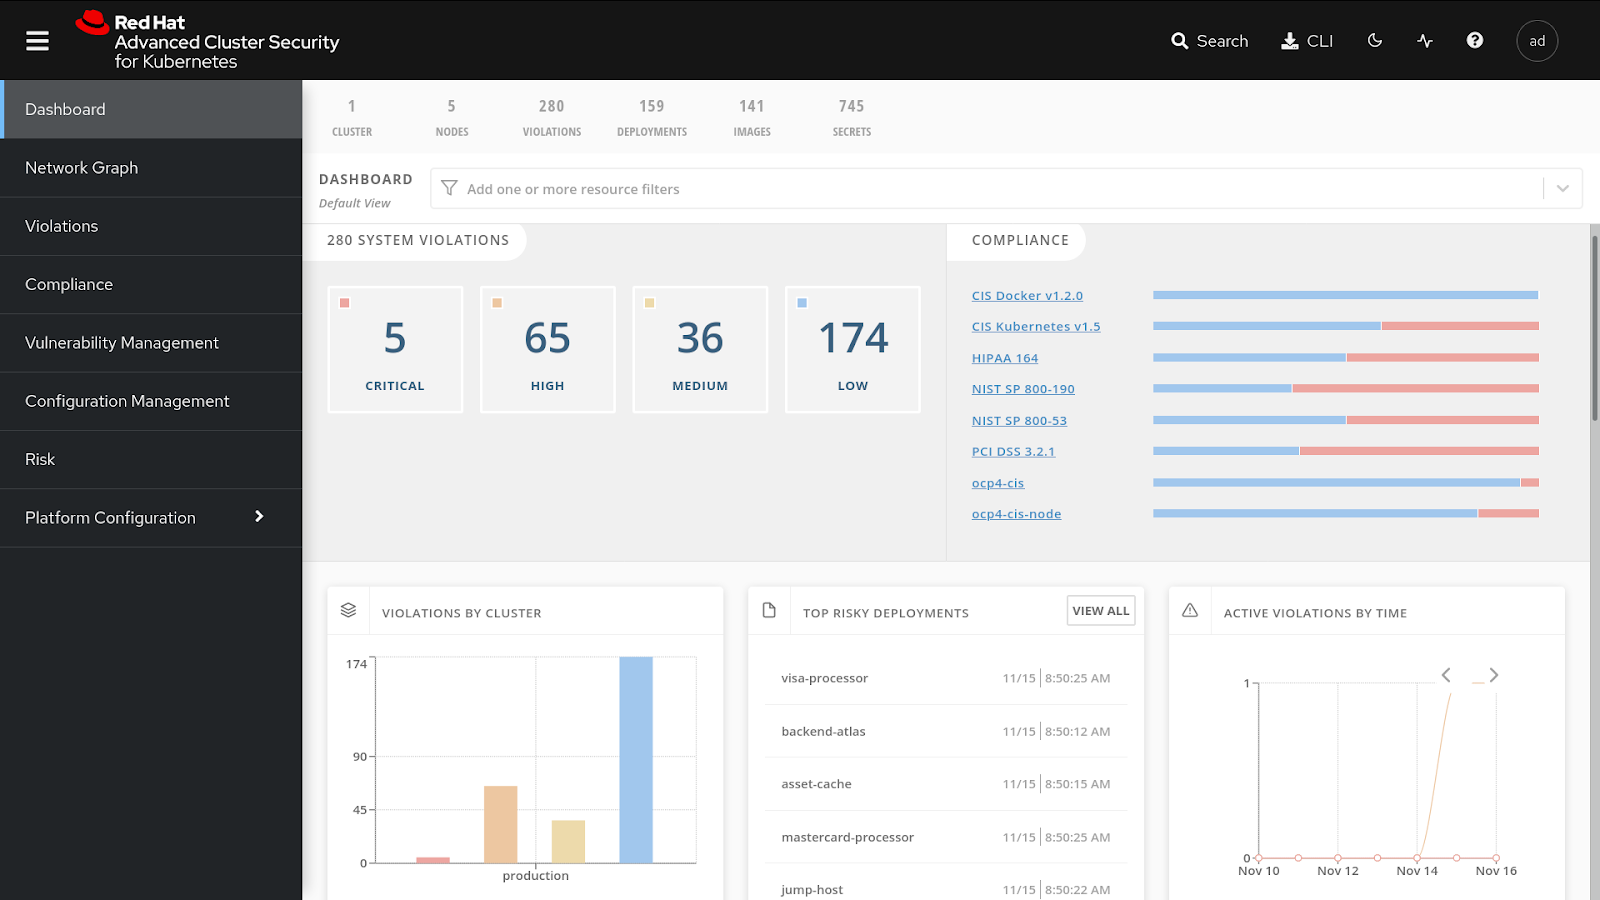
Our Kubernetes-native security solution comes pre-built with compliance checks for CIS benchmarks for Docker, Kubernetes and OpenShift as well as other industry standards such as PCI, HIPAA, and NIST SP 800-90 and SP 800-53. Compliance reports can be generated with a single click and handed to auditors as evidence.

Red Hat Advanced Cluster Security for Kubernetes delivers the next generation in container security, with a Kubernetes-native architecture that is both container-native and Kubernetes-native. Leveraging the declarative data and built-in controls of Kubernetes minimizes operational risk, accelerates developer productivity, and reduces operational cost while immediately improving your security posture across applications lifecycle Build, Deploy and Runtime phases.

wtorek, 17 sierpnia 2021

Expose MongoDB as REST service using Camel Quarkus

In this blog post I'll show you how to create a REST service which exposes CRUD functionality from a MongoDB database using Camel Quarkus framework. 

Why Camel Quarkus?

As a Java developer I prefer to use Java frameworks to develop my code. With Apache Camel I can develop faster integration logic without need to take care of low level boilerplate coding and I can focus mostly on business logic. With Camel XML dsl I can follow low code approach using XML instead of Java, which is even faster and less error prone!

With Quarkus I can create super thin application binaries and container images which allows me to run applications and containers with minimal resources footprint compared to regular JVM and start them super fast in milliseconds.

Camel Quarkus combines the best of both worlds: Java integration developer experience of Camel with resource consumption optimization of Quarkus.

Let's get started!

The first step is to create Camel Quarkus maven project on your local machine

mvn \
io.quarkus:quarkus-maven-plugin:1.13.7.Final:create \
-DprojectGroupId=org.redhat \
-DprojectArtifactId=camel-quarkus-mongodb-client \
-DplatformGroupId=io.quarkus \
-DplatformVersion=1.13.7.Final \
-Dextensions=camel-quarkus-xml-io-dsl,camel-quarkus-direct,camel-quarkus-mongodb,camel-quarkus-log,camel-quarkus-jackson,camel-quarkus-http,camel-quarkus-rest,camel-quarkus-bean

Next we must edit our application configuration and add required parameters. Please check Quarkus documentation for more details about their meaning.

$ cd camel-quarkus-mongodb-client

$ vi src/main/resources/application.properties

quarkus.package.type=uber-jar

camel.context.name = hotelsdb-client
camel.rest.component = platform-http

camel.main.routes-include-pattern = classpath:/camel-routes.xml,classpath:/camel-rests.xml


quarkus.mongodb.connection-string = mongodb://localhost:27017
quarkus.mongodb.database = hotelsdb

batchLimit = 100

quarkus.http.port = 8080
quarkus.http.host = 0.0.0.0

As you might have noticed in above configuration our business logic will be placed in two Camel files: camel-routes.xml and camel-rests.xml

First we'll edit camel-rests.xml where we'll define our REST services endpoints

$ vi src/main/resources/camel-rests.xml

<?xml version="1.0" encoding="UTF-8"?>
<rests xmlns="http://camel.apache.org/schema/spring">
    <rest id="cache" path="/camel">
         <post id="putToCache" consumes="application/json" produces="application/json" uri="/v1/cache/{cid}">
            <route>
                <doTry>
                    <to uri="direct:putToCache"/>
                    <doCatch>
                        <exception>java.lang.Exception</exception>
                        <to uri="direct:logError"/>
                    </doCatch>
                </doTry>
            </route>
         </post>
         <get id="getFromCache" produces="application/json" uri="/v1/cache/{cid}/{limit}">
            <route>
                <doTry>
                    <to uri="direct:getFromCache"/>
                    <doCatch>
                        <exception>java.lang.Exception</exception>
                        <to uri="direct:logError"/>
                    </doCatch>
                </doTry>
            </route>
        </get>
    </rest>
</rests>

This REST services endpoints will send requests to the routes which must be defined in the second camel file camel-routes.xml

$ vi src/main/resources/camel-routes.xml

<?xml version="1.0" encoding="UTF-8"?>
<routes id="DBClient" xmlns="http://camel.apache.org/schema/spring">
    <route id="Put to collection">
        <from uri="direct:putToCache"/>
        <log loggingLevel="INFO" message="Inserting to collection ${header.cid} 1 document..."/>
        <convertBodyTo type="java.lang.String"/>
        <to uri="direct:insertRecord"/>
        <log loggingLevel="INFO" message="Done"/>
        <setBody>
            <simple>{"count": 1}</simple>
        </setBody>
        <removeHeaders pattern="*"/>
    </route>
    <route id="Insert record to collection">
        <from uri="direct:insertRecord"/>
        <recipientList>
            <simple>mongodb:camelMongoClient?database={{quarkus.mongodb.database}}&amp;collection=${header.cid}&amp;operation=save</simple>
        </recipientList>
        <log loggingLevel="INFO" message="Inserted to collection ${header.cid} document with id ${header.CamelMongoOid}."/>
    </route>
    <route id="Get from collection">
        <from uri="direct:getFromCache"/>
        <validate>
            <simple>${header.limit} range '1..{{batchLimit}}'</simple>
        </validate>
        <log loggingLevel="INFO" message="Get all from cache ${header.cid} with limit ${header.limit}"/>
        <setHeader name="CamelMongoDbSortBy">
            <!--  descending by _id -->
            <constant>{"_id" : -1}</constant>
        </setHeader>
        <setHeader name="CamelMongoDbLimit">
            <simple>${header.limit}</simple>
        </setHeader>
        <setHeader name="CamelMongoDbBatchSize">
            <constant>{{batchLimit}}</constant>
        </setHeader>
        <recipientList>
            <simple>mongodb:camelMongoClient?database={{quarkus.mongodb.database}}&amp;collection=${header.cid}&amp;operation=findAll</simple>
        </recipientList>
        <to uri="direct:processOutput"/>
    </route>
    <route id="Process output">
        <from uri="direct:processOutput"/>
        <marshal>
            <json id="json" library="Jackson"/>
        </marshal>
        <removeHeaders pattern="*"/>
    </route>
    <route id="Log error">
        <from uri="direct:logError"/>
        <log logName="net.gmsworld.server.camel" loggingLevel="ERROR" message="Operation failed with exception: ${exception.stacktrace}"/>
        <setBody>
            <simple>{"error" : "Operation failed"}</simple>
        </setBody>
        <removeHeaders pattern="*"/>
        <setHeader name="CamelHttpResponseCode">
            <constant>500</constant>
        </setHeader>
    </route>
</routes>

Finally we are going to modify the automatically generated JUnit test case source file. Of course you can create your own JUnit test cases just like with a regular Java applications.

$ vi src/test/java/org/redhat/GreetingResourceTest.java

package org.redhat;

import io.quarkus.test.junit.QuarkusTest;
import org.junit.jupiter.api.Test;

import static io.restassured.RestAssured.given;
import static org.hamcrest.CoreMatchers.is;

@QuarkusTest
public class GreetingResourceTest {

    @Test
    public void testHelloEndpoint() {
        given()
          .when().get("/camel/v1/cache/test/10")
          .then()
             .statusCode(200)
             .body(is("[]"));
    }
}

Now we are ready for testing!

For testing purposes let's run on the local machine a MongoDB database container. Moving forward I'll use podman for all container related actions, but if you prefer you can use any other OCI compliant tool.

$ podman run -d --name mongodb -p 27017:27017 quay.io/bitnami/mongodb:4.0

Before proceeding make sure MongoDB container is up and running

$ podman ps
CONTAINER ID  IMAGE                        COMMAND               CREATED      STATUS            PORTS                     NAMES
780b48bfd200  quay.io/bitnami/mongodb:4.0  /opt/bitnami/scri...  11 days ago  Up 2 seconds ago  0.0.0.0:27017->27017/tcp  mongodb

Now we can quickly execute JUnit test

$ mvn clean package

If it has succeeded we can start our REST service in developer mode on the local machine using maven Quarkus plugin

$ mvn clean package quarkus:dev -DskipTests=true

Once our service is up and running we can send some requests to test it

$ curl -v -H "Content-Type: application/json" -X POST -d '{"username":"xyz","password":"xyz"}'  http://localhost:8080/camel/v1/cache/test

$ curl -v http://localhost:8080/camel/v1/cache/test/10

Next we will compile or Camel Quarkus application to native executable using GraalVM

First we need to prepare additional configuration for native compiler to make sure required XML dsl files and Java classes are included in the output native executable.

vi src/main/resources/application.properties

#add following parameter
quarkus.native.additional-build-args =\
   -H:ResourceConfigurationFiles=resources-config.json,\
   -H:ReflectionConfigurationFiles=reflection-config.json

vi src/main/resources/resources-config.json

{
  "resources": [
    {
      "pattern": ".*\\.xml$"
    }
  ]
}

vi src/main/resources/reflection-config.json

[
  {
    "name" : "org.bson.types.ObjectId",
    "allDeclaredConstructors" : true,
    "allPublicConstructors" : true,
    "allDeclaredMethods" : true,
    "allPublicMethods" : true,
    "allDeclaredFields" : true,
    "allPublicFields" : true
  },
  {
    "name" : "java.lang.Exception",
    "allDeclaredConstructors" : true,
    "allPublicConstructors" : true,
    "allDeclaredMethods" : true,
    "allPublicMethods" : true,
    "allDeclaredFields" : true,
    "allPublicFields" : true
  } 
]

In order to create native executable you can either download to your local machine GraalVM and execute following maven command

$ mvn clean package -Pnative -DskipTests=true -DGRAALVM_HOME=/opt/graalvm/graalvm-ce-java11-21.0.0.2/

or you can run containerized native executable builder

$ mvn package -Pnative \
-Dquarkus.native.container-build=true \
-Dquarkus.native.container-runtime=podman \
-Dquarkus.native.builder-image=registry.access.redhat.com/quarkus/mandrel-20-rhel8

Both commands should produce native executable which can be optionally analysed using following command

$ readelf -h ./target/camel-quarkus-mongodb-client-1.0.0-SNAPSHOT-runner
ELF Header:
  Magic:   7f 45 4c 46 02 01 01 00 00 00 00 00 00 00 00 00
  Class:                             ELF64
  Data:                              2's complement, little endian
  Version:                           1 (current)
  OS/ABI:                            UNIX - System V
  ABI Version:                       0
  Type:                              EXEC (Executable file)
  Machine:                           Advanced Micro Devices X86-64


Now you can run this binary and test it the same way as before. Please note this native executable will start REST service in just a couple of milliseconds

$ ./target/camel-quarkus-mongodb-client-1.0.0-SNAPSHOT-runner

2021-08-16 13:12:01,922 INFO  [io.quarkus] (main) camel-quarkus-mongodb-client 1.0.0-SNAPSHOT native (powered by Quarkus 1.13.7.Final) started in 0.059s. Listening on: http://0.0.0.0:8080
2021-08-16 13:12:01,922 INFO  [io.quarkus] (main) Profile prod activated.
2021-08-16 13:12:01,922 INFO  [io.quarkus] (main) Installed features: [camel-attachments, camel-bean, camel-core, camel-direct, camel-http, camel-jackson, camel-log, camel-mongodb, camel-platform-http, camel-rest, camel-support-common, camel-support-commons-logging, camel-support-httpclient, camel-support-mongodb, camel-xml-io-dsl, cdi, mongodb-client, mutiny, resteasy, smallrye-context-propagation, vertx, vertx-web]

If you are curious you can also check how much memory is consumed by the native executable

$ ps -o pid,rss,command -p $(pgrep -f runner)
  PID   RSS COMMAND
 2575 61956 ./target/camel-quarkus-mongodb-client-1.0.0-SNAPSHOT-runner

Less than 62MB, pretty compact compared to a regular JVM application!

Let's repeat the test executed before to make sure our Camel Quarkus application is up and running

$ curl -v -H "Content-Type: application/json" -X POST -d '{"username":"xyz","password":"xyz"}'  http://localhost:8080/camel/v1/cache/test

$ curl -v http://localhost:8080/camel/v1/cache/test/10

Finally, let's create a lightweight container image. For that I'll use ubi-micro base image extended by required for Quarkus native libraries created using this script. To execute this script on your local machine you'll need yet another tool for building images called buildah.

$ vi Containerfile.distroless

FROM quay.io/jstakun/ubi-micro-quarkus:latest
MAINTAINER Jaroslaw Stakun jstakun@redhat.com
LABEL quarkus-version=1.13.7.Final
COPY ./target/*-runner /application
RUN chgrp 0 /application && chmod 110 /application
USER 1001
CMD /application
EXPOSE 8080

$ podman build -f ./Containerfile.distroless -t quay.io/jstakun/camel-quarkus-mongodb-client:latest

$ podman push quay.io/jstakun/camel-quarkus-mongodb-client:latest

With the image deployed to the public container images registry you can run the container anywhere you want. Here is how you can do it in Red Hat OpenShift Container Platform.

$ oc new-project camel-quarkus-mongodb

$ oc new-app -e MONGODB_DATABASE=testdb -e MONGODB_USER=test -e MONGODB_PASSWORD=test -e MONGODB_ADMIN_PASSWORD=admin mongodb:3.6
  

#please note using environment variables you can replace values of application properties defined in source code
$ oc new-app --name=frontend -e QUARKUS_MONGODB_CONNECTION_STRING=mongodb://mongodb:27017 -e QUARKUS_MONGODB_DATABASE=testdb  -e QUARKUS_MONGODB_CREDENTIALS_USERNAME=test -e QUARKUS_MONGODB_CREDENTIALS_PASSWORD=test quay.io/jstakun/camel-quarkus-mongodb-client:latest

$ oc expose service/frontend

Finally let's test our REST service pod running in OpenShift

$ ROUTE=http://$(oc get route | grep frontend | awk '{print $2}') && echo $ROUTE

$ curl -v -H "Content-Type: application/json" -X POST -d '{"username":"xyz","password":"xyz"}' $ROUTE/camel/v1/cache/test

$ curl -v $ROUTE/camel/v1/cache/test/10
 

You can find all source codes of this tutorial in my GitHub repository. All container images referenced in this post are available at the quay.io public container images registry.

Thanks for reading!