środa, 7 grudnia 2022

Checking Security Context Constraints permissions

Similar to the way that RBAC resources control user access, administrators can use security context constraints (SCCs) to control permissions for pods. These permissions include actions that a pod can perform and what resources it can access. You can use SCCs to define a set of conditions that a pod must run with to be accepted into the system.

Security context constraints allow an administrator to control:

  • Whether a pod can run privileged containers with the allowPrivilegedContainer flag.

  • Whether a pod is constrained with the allowPrivilegeEscalation flag.

  • The capabilities that a container can request

  • The use of host directories as volumes

  • The SELinux context of the container

  • The container user ID

  • The use of host namespaces and networking

  • The allocation of an FSGroup that owns the pod volumes

  • The configuration of allowable supplemental groups

  • Whether a container requires write access to its root file system

  • The usage of volume types

  • The configuration of allowable seccomp profiles

By default the cluster contains several default security context constraints (SCCs)  with different sets of permissions and privileges as per the documentation

You can specify SCCs as resources that are handled by RBAC. This allows you to scope access to your SCCs to a certain project or to the entire cluster. Assigning users, groups, or service accounts directly to an SCC retains cluster-wide scope.

For example when you assign anyuid scc to service account my-sa

$ oc adm policy add-scc-to-user anyuid -z my-sa 

corresponding role will be created and bound to the service account with cluster scope.

apiVersion: rbac.authorization.k8s.io/v1
kind: ClusterRole
metadata:
  name: system:openshift:scc:anyuid
rules:
- apiGroups:
  - security.openshift.io
  resourceNames:
  - anyuid
  resources:
  - securitycontextconstraints
  verbs:
  - use

As an cluster admin using oc cli you can check who has permissions to use specific scc.

$ oc adm policy who-can use scc anyuid

resourceaccessreviewresponse.authorization.openshift.io/<unknown>

Namespace: default
Verb:      use
Resource:  securitycontextconstraints.security.openshift.io

Users:  system:admin
        system:serviceaccount:apps-mlapps:my-sa
        system:serviceaccount:apps-sealed-secrets:secrets-controller
        ...

Groups: system:cluster-admins
        system:masters


If you are using Advanced Cluster Security for Kubernetes you can also check who has these permissions using ACS Central web UI:

On the left hand side Menu click on Configuration Management and next on the right top side click on RBAC Visibility & Configuration dropdown list and select Roles. Finally type "Role: system:openshift:scc" in the filter.

Click on any available link in User & Groups or Service Account columns to reveal list of users, groups or service accounts bound to selected SCC.


piątek, 29 lipca 2022

Configure timezone in your OpenShift cluster

You can configure timezone on your OpenShift RHEL CoreOS nodes using following machine config:

apiVersion: machineconfiguration.openshift.io/v1
kind: MachineConfig
metadata:
  labels:
    machineconfiguration.openshift.io/role: worker
  name: worker-custom-timezone-configuration
spec:
  config:
    ignition:
      config: {}
      security:
        tls: {}
      timeouts: {}
      version: 2.2.0
    networkd: {}
    passwd: {}
    storage: {}
    systemd:
      units:
      - contents: |
          [Unit]
          Description=set timezone
          After=network-online.target

          [Service]
          Type=oneshot
          ExecStart=timedatectl set-timezone Europe/London

          [Install]
          WantedBy=multi-user.target
        enabled: true
        name: custom-timezone.service
  osImageURL: "" 

Containers don't typically inherit the host time zone configuration, as container images often set their own time zone (usually UTC). It is possible to change the timezone in pods (but the OCP platform pods) using one of the following methods:

1. Set an environment variable. This sets TZ in any containers to the timezone specified.

$ oc get deployments
$ oc set env deployments/dc_name TZ=Europe/London 

2. Mount /etc/localtime to use the timezone stored in a configmap

$ oc create configmap tz-london --from-file=localtime=/usr/share/zoneinfo/Europe/London
$ oc set volumes deployments/dc_name --add \
    --type=configmap --name=tz --configmap-name=tz-london \
    --mount-path=/etc/localtime --sub-path=localtime 

If you prefer first method are you are using Red Hat Base Universal Minimal images you'll need to reinstall tzdata package to populate /usr/share/zoneinfo

FROM registry.redhat.io/ubi8-minimal
RUN microdnf reinstall tzdata -y 

czwartek, 5 maja 2022

Multi tenant metrics collection from OpenShift built in Prometheus

In one of my previous posts I've described 3 ways to collect metrics stored in OpenShift built-in Prometheus metrics database. Now I'd like to show you how you can limit access to metrics per tenant projects (namespaces). 

Built-in Thanos Queries contains dedicated tenancy port which requires namespace parameter to access metrics of objects belonging to the project. If you want to expose this port outside of the cluster you'll need to create custom route (ingress):

kind: Route

apiVersion: route.openshift.io/v1

metadata:

  name: multitenant-thanos-querier

  namespace: openshift-monitoring

spec:

  host: ROUTE_HOSTNAME

  path: /api

  to:

    kind: Service

    name: thanos-querier

    weight: 100

  port:

    targetPort: tenancy

  tls:

    termination: reencrypt

  wildcardPolicy: None


Next you can execute follwing commands to query metrics from selected namespace: 


PROJECT=sample-app-prod

SA=querier

oc project $PROJECT

oc create sa $SA

TOKEN=$(oc sa get-token $SA)

URL=$(oc get route -n openshift-monitoring | grep multitenant | awk '{print $2}')


You don't need to assign cluster-monitoring-view role to the service account but only view role in the project where you want to query the metrics:  


oc adm policy add-cluster-role-to-user view -z $SA


In the thanos querier query you must enter namespace parameter to specify which namespace metrics you want to get:  


curl -v -k -H "Authorization: Bearer $TOKEN" "https://$URL/api/v1/query?namespace=$PROJECT&query=kube_pod_status_ready"


In the results you will only see values of metrics which are related to your selected project:  

{"status":"success","data":{"resultType":"vector","result":[{"metric":{"__name__":"kube_pod_status_ready","condition":"false","container":"kube-rbac-proxy-main","endpoint":"https-main","job":"kube-state-metrics","namespace":"sample-app-prod","pod":"hello-quarkus-5859859f9f-vbhjh","prometheus":"openshift-monitoring/k8s","service":"kube-state-metrics"},"value":[1651068513.646,"0"]}]}} 

That's it. Now you only have access to metrics from the projects where you have the view role.

czwartek, 20 stycznia 2022

Harden your OpenShift clusters with CIS Openshift benchmark

In this blog post I'll describe how you can harden your OpenShift clusters  using the Compliance Operator. It is an OpenShift Operator that allows an administrator to run different compliance scans and provide remediations for the issues found. Compliance Operator leverages OpenSCAP under the hood to perform the scans. Among the others it provides CIS OpenShift benchmark compliance profiles, which provides comprehensive set of security controls for OpenShift clusters similar to CIS Kubernetes.

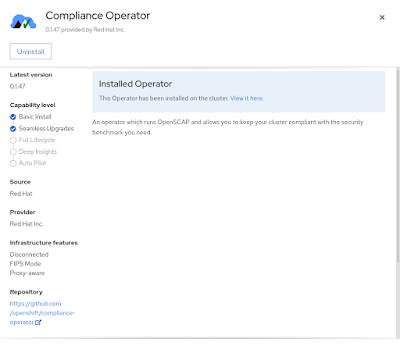
You can install it quickly from the OpenShift Web Console Operator Hub page. It will be installed by default in the openshift-compliance project.

After the installation you can check what compliance profiles are available:

$ NAMESPACE=openshift-compliance

$ oc get -n $NAMESPACE profiles.compliance
NAME                 AGE
ocp4-cis             3d2h
ocp4-cis-node        3d2h
ocp4-e8              3d2h
ocp4-moderate        3d2h
ocp4-moderate-node   3d2h
ocp4-nerc-cip        3d2h
ocp4-nerc-cip-node   3d2h
ocp4-pci-dss         3d2h
ocp4-pci-dss-node    3d2h
rhcos4-e8            3d2h
rhcos4-moderate      3d2h
rhcos4-nerc-cip      3d2h

For CIS Openshift benchmark compliance scan we'll use ocp4-cis for master nodes scanning and ocp4-cis-node for worker nodes scanning.  You can review each of them and check what compliance rules are included using following commands:

$ oc get -n $NAMESPACE -o yaml profiles.compliance ocp4-cis

$ oc get -n $NAMESPACE -o yaml profiles.compliance ocp4-cis-node

You can run both scans using following commands:

$ echo "---
apiVersion: compliance.openshift.io/v1alpha1
kind: ScanSettingBinding
metadata:
  name: ocp4-cis-node
profiles:
  - name: ocp4-cis-node
    kind: Profile
    apiGroup: compliance.openshift.io/v1alpha1
settingsRef:
  name: default
  kind: ScanSetting
  apiGroup: compliance.openshift.io/v1alpha1
" | oc create -f - -n $NAMESPACE

$ echo "---
apiVersion: compliance.openshift.io/v1alpha1
kind: ScanSettingBinding
metadata:
  name: ocp4-cis
profiles:
  - name: ocp4-cis
    kind: Profile
    apiGroup: compliance.openshift.io/v1alpha1
settingsRef:
  name: default
  kind: ScanSetting
  apiGroup: compliance.openshift.io/v1alpha1
" | oc create -f - -n $NAMESPACE

Wait until they finish executing and show PHASE value DONE as below:

$ oc get -n $NAMESPACE compliancesuites
NAME              PHASE   RESULT
ocp4-cis          DONE    NON-COMPLIANT
ocp4-cis-node     DONE    NON-COMPLIANT

If you'll see RESULT value COMPLANT you are done, but most probably you won't.

Extracting raw scan results is a bit complicated. The scans provide two kinds of raw results: the full report in the ARF format and just the list of scan results in the XCCDF format. The ARF reports are, due to their large size, copied into persistent volumes. The XCCDF results are much smaller and can be stored in a configmap, from which you can extract the results. For easier filtering, the configmaps are labeled with the scan name. You can find more details about scan results extracting here

Here is just simple example of how you can extract scan results to local file system and find failed compliance rules:

$ oc get -n $NAMESPACE cm -l=compliance.openshift.io/scan-name=ocp4-cis

$ oc extract -n $NAMESPACE cm/ocp4-cis-api-checks-pod --keys=results --confirm

$ cat results | grep fail -B1
          <rule-result idref="xccdf_org.ssgproject.content_rule_audit_log_forwarding_enabled" role="full" time="2022-01-20T07:30:17+00:00" severity="medium" weight="1.000000">
            <result>fail</result>
--
          <rule-result idref="xccdf_org.ssgproject.content_rule_configure_network_policies_namespaces" role="full" time="2022-01-20T07:30:17+00:00" severity="high" weight="1.000000">
            <result>fail</result>

Great thing about the Compliance Operator is that for majority of failed compliance rules there will be also remediation created automatically:

$ oc get -n $NAMESPACE complianceremediations

NAME
ocp4-cis-api-server-encryption-provider-config
... 

$ oc get -n $NAMESPACE complianceremediation/ocp4-cis-api-server-encryption-provider-config -o yaml

Finally these remediations can be applied manually to the cluster configuration:

$ oc patch -n $NAMESPACE complianceremediations/ocp4-cis-api-server-encryption-provider-config --patch '{"spec":{"apply":true}}' --type=merge

Applying all remediations might not be enough to achieve COMPLIANT results from the scan. There are a couple of compliance rules that will require manual intervention i.e. creation of network policies in every namespace or Kubernetes API audit log forwarding off the cluster configuration. For guidelines on how to implement these remediations please refer to Hardening Guide for OpenShift Container Platform or CIS RedHat OpenShift Container Platform v4 Benchmark.